/your message
has been successfully
sent
has been successfully
sent
Thank you for choosing our company.
Our specialists will contact you as soon as possible.
Our specialists will contact you as soon as possible.
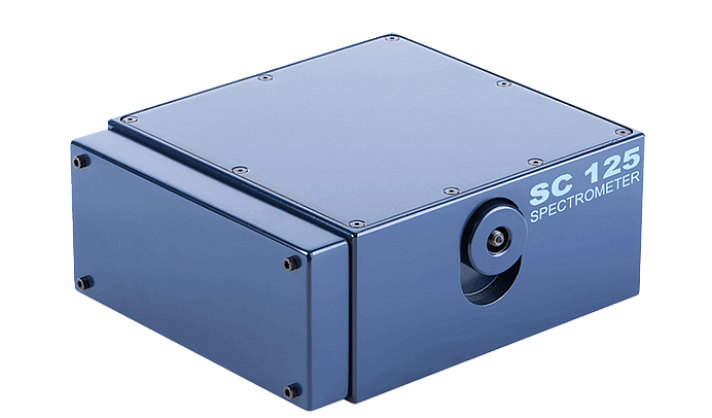
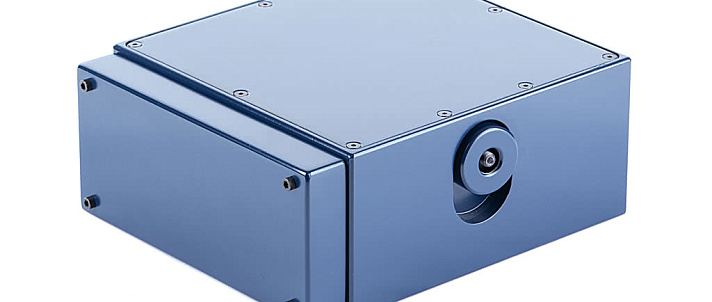
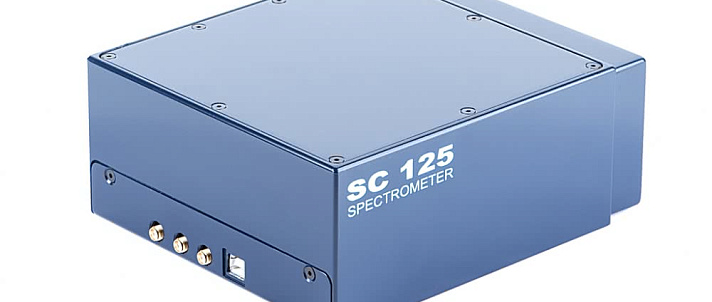
The high-aperture optical bench of the SC125 has no moving parts and minimizes the number of reflective surfaces. The SC125 features a monolithic housing, thus ensuring long-time measurement stability. The case has internal fins (light traps) that allow reducing stray light – a typical problem of compact short-focal length instruments.
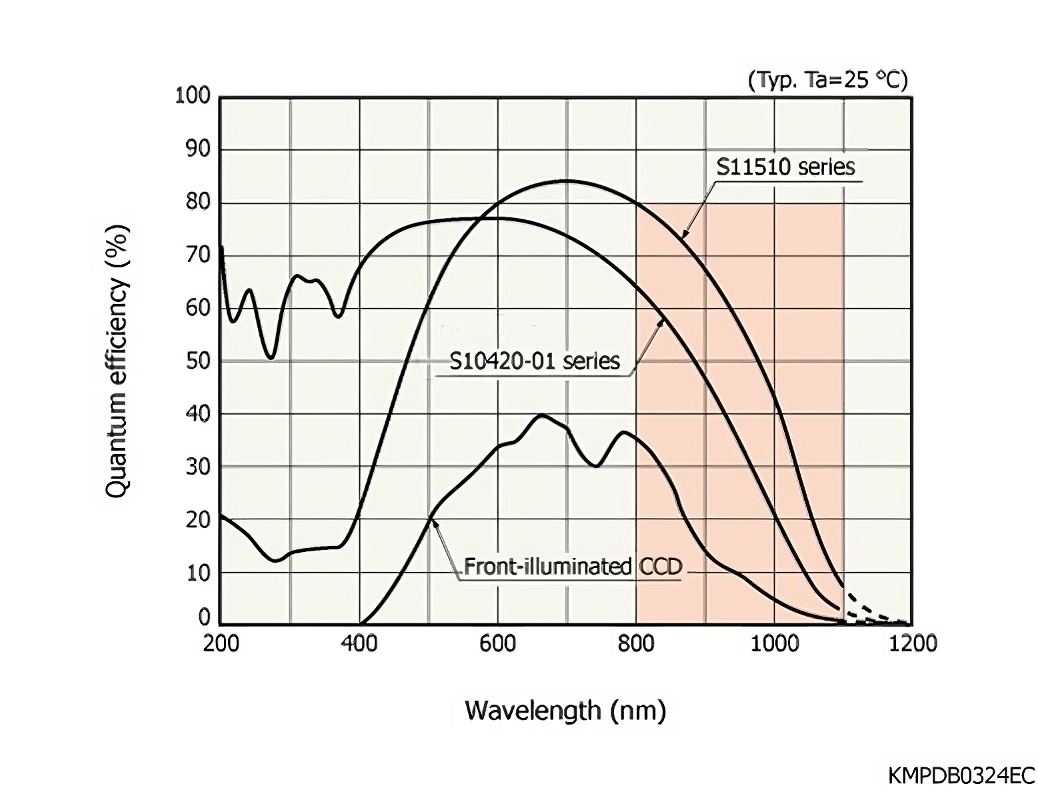
The SC125 may contain as a detector either one of two non-cooled Hamamatsu back-thinned CCD-arrays without a charge-storage section (back-thinned FFT CCD), operating in the binning mode. Both arrays have wide spectral range and excellent sensitivity in the UV (see below for the curves of each detector spectral sensitivity and their specifications). These two arrays differ in quantum efficiency, data reading rate, dynamic range, and in pixel active area size.
.jpg)
The detector based on the S7030-1006 CCD-array is more sensitive, has lower noise, better values of dynamic range and uniformity. The detector based on the S10420-1106 CCD array is faster, has anti-blooming and, since it has a greater number of pixels and smaller pixel size, ensures better spectral resolution than the S7030-1006. The IMAGING Version (Optional) features an astigmatism compensator – cylindrical lens – installed after the entrance slit. This further enhances of system sensitivity.
Spectral curve of sensitivity of the back-thinned CCD detector model S10420-1106
.jpg)
Spectral curve of sensitivity of the back-thinned FFT-CCD detector model S7030-1006 in comparison with front-illuminated CCD with and without UV-coating
| SPECTROMETER MODEL | SC125- S10420 | SC125- S11510 | SC125- S7030 |
| Spectral range, nm | 200 — 1100 | ||
| Focal length, mm | 125 | ||
| F/number | 1 : 3,9 | ||
| Entrance slit (one to choose) | fixed width: 14μm, 30μm and 50 μm | ||
| Spectral resolution | depends on selected diffraction grating (see table below) | ||
| CCD-detector model |
S10420-1106 Hamamatsu |
S11510-1106 Hamamatsu |
S7030-1006 Hamamatsu |
| Number of pixels | 2068 × 70 | 1024 × 64 | |
| Number of active pixels | 2048 × 64 | 1024 × 58 | |
| Pixel size, μm | 14 × 14 | 24 × 24 | |
| Active area size, mm | 28,672 × 0,896 | 24,6 × 1,4 | |
| Maximum spectral sensitivity, nm | 500 | 700 | 650 |
| Maximum quantum efficiency? % | >75 | >90 | |
| Non-uniformity of sensitivity(1),% | ±3 | ±3 | |
| Anti-blooming(2) | Yes | No | |
| ADC Resolution | 16bit, 250 kHz | 16bit, 125 kHz | |
| Mean-square reading noise, ADC counts | <4 | <2 | |
| Dynamic range in the binning mode | ~ 16000 : 1 | ~ 33 000 : 1 | |
| Exposure time | 8,3 ms — 5 s (3) | 8,2 ms — 2 s (3) | |
| Frame processing time in the binning mode | 9,39 ms | 9,12 ms | |
| Thermoelectric cooling | No | ||
| Operating temperature | 10 – 30 °С | ||
| Computer interface | Full Speed USB | ||
| Triggering | internal / external | ||
| Optical input |
— direct input through the SC125 input slit — Optical Fiber : 0.6 (0.4)mm diameter, 1m length, SMA-905 connector |
||
| Dimensions, weight | 158 × 182 × 74 мм; 2,2 кг | ||
* Specifications are subject to change without notice.
1) Signal level — 50% of saturation.
2) anti-blooming – sensor’s feature eliminating overflow of charges from over-exposed pixels to the neighboring ones.
3) maximum storage time is deemed to be the time at which dark signal reaches 10% of the dynamic range at the ambient temperature +25°С
At the time of placing your order you should choose a grating lines density (i.e. spectral resolution of your instrument), as well as the spectral range for operation. For your convenience the table below lists the average values of grating dispersion, spectral resolution and multichannel array bandpass.
| Diffraction gratings, lines/mm | 1800 | 1200 | 900 | 600 | 400 | 300 | 200 |
| — possible spectral range of grating operation, nm | 180-600 | 180-900 | 180-1100 | 180-1100 | 190-1100 | 200-1100 | 200-1100 |
| — multichannel array bandpass (average), nm1) | 1052)923) | 1702)1453) | 2302)2003) | 3502)3003) | 5402)4603) | 7202)6203) | 10002)9203) |
| — reciprocal linear dispersion (average), nm/mm1) | 3.8 | 6.0 | 8.2 | 12.5 | 19.0 | 25.4 | 38.0 |
| — spectral resolution (average), nm | 0.162)0.223) | 0.252)0.363) | 0.342)0.53) | 0.52)0.753) | 0.82)1.13) | 1.02)1.53) | 1.62)2.33) |
1) for 300nm wavelength.
2) for the SC125- S10420 model.
3) for the SC125- S7030 model.
EXAMPLE: If you are interested in the1200 lines/mm grating and the S10420-1106 detector (spectral resolution of 0.25nm), then you should choose the location of 170nm multichannel array bandpass within the possible 180-900nm spectral range of the grating. For instance, the SC125- S10420 spectrometer operating in the range of 250-420nm with 0.25nm resolution.
The values indicated in the table are calculated for 300nm wavelength. With increased wavelength, dispersion of a specific grating and multichannel array bandpass are slightly decreased and resolution is improved. Contact a SOLAR LS specialist for more precise calculation of parameters for your instrument.
At your request the SC125 spectrometer can be equipped with optional calibration of spectral sensitivity.
Spectral ranges of calibration:
Whereas in the past the spectrum of your light source was superimposed by spectral curves of diffraction grating efficiency, detector sensitivity, reflective index of mirrors, now you have the opportunity to restore true spectra of the analysed source. You will be able to:
* Features marked with an asterisk are not included into the software of your spectrometer; they are implemented by exporting to external programs.